Note
Go to the end to download the full example code.
Datasets
A basic tutorial on how to list, load and visualize datasets.
In general, we recommend working with tasks, so that the results can be easily reproduced. Furthermore, the results can be compared to existing results at OpenML. However, for the purposes of this tutorial, we are going to work with the datasets directly.
# License: BSD 3-Clause

import openml
List datasets
datasets_df = openml.datasets.list_datasets(output_format="dataframe")
print(datasets_df.head(n=10))
    did             name  ...  NumberOfNumericFeatures NumberOfSymbolicFeatures
2     2           anneal  ...                      6.0                     33.0
3     3         kr-vs-kp  ...                      0.0                     37.0
4     4            labor  ...                      8.0                      9.0
5     5       arrhythmia  ...                    206.0                     74.0
6     6           letter  ...                     16.0                      1.0
7     7        audiology  ...                      0.0                     70.0
8     8  liver-disorders  ...                      6.0                      0.0
9     9            autos  ...                     15.0                     11.0
10   10            lymph  ...                      3.0                     16.0
11   11    balance-scale  ...                      4.0                      1.0

[10 rows x 16 columns]
Download a dataset
# Iris dataset https://www.openml.org/d/61
dataset = openml.datasets.get_dataset(dataset_id="iris", version=1)

# Print a summary
print(
    f"This is dataset '{dataset.name}', the target feature is "
    f"'{dataset.default_target_attribute}'"
)
print(f"URL: {dataset.url}")
print(dataset.description[:500])
This is dataset 'iris', the target feature is 'class'
URL: https://api.openml.org/data/v1/download/61/iris.arff
**Author**: R.A. Fisher
**Source**: [UCI](https://archive.ics.uci.edu/ml/datasets/Iris) - 1936 - Donated by Michael Marshall
**Please cite**:

**Iris Plants Database**
This is perhaps the best known database to be found in the pattern recognition literature.  Fisher's paper is a classic in the field and is referenced frequently to this day.  (See Duda & Hart, for example.)  The data set contains 3 classes of 50 instances each, where each class refers to a type of iris plant.  One class
Load a dataset
# X - An array/dataframe where each row represents one example with
# the corresponding feature values.
# y - the classes for each example
# categorical_indicator - an array that indicates which feature is categorical
# attribute_names - the names of the features for the examples (X) and
# target feature (y)
X, y, categorical_indicator, attribute_names = dataset.get_data(
    dataset_format="dataframe", target=dataset.default_target_attribute
)
Tip: you can get a progress bar for dataset downloads, simply set it in the configuration. Either in code or in the configuration file (see also the introduction tutorial)
openml.config.show_progress = True
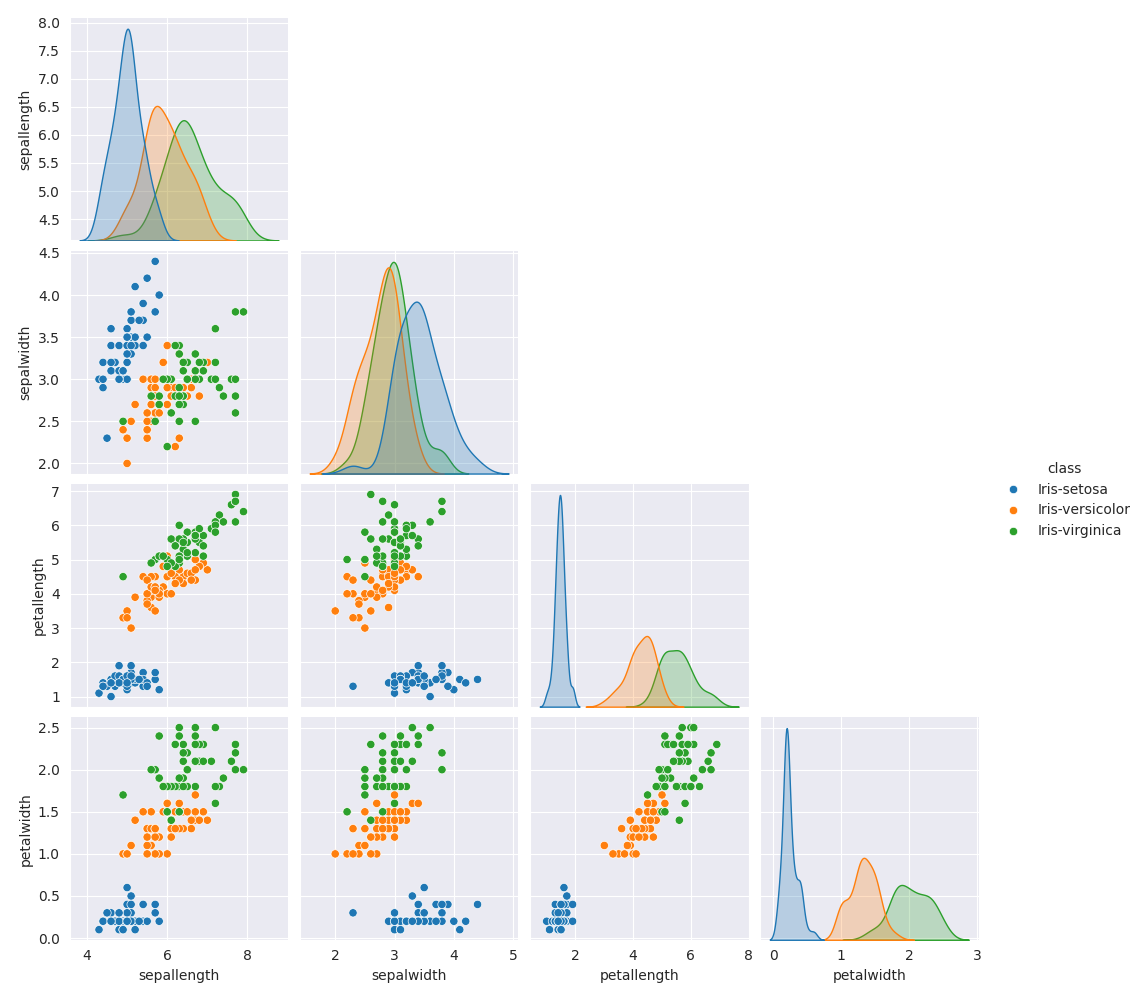
Visualize the dataset
import pandas as pd
import seaborn as sns
import matplotlib.pyplot as plt

sns.set_style("darkgrid")


def hide_current_axis(*args, **kwds):
    plt.gca().set_visible(False)


# We combine all the data so that we can map the different
# examples to different colors according to the classes.
combined_data = pd.concat([X, y], axis=1)
iris_plot = sns.pairplot(combined_data, hue="class")
iris_plot.map_upper(hide_current_axis)
plt.show()

Total running time of the script: (0 minutes 10.047 seconds)
