
Note
Go to the end to download the full example code.
Plotting hyperparameter surfaces
# License: BSD 3-Clause

import openml
import numpy as np
First step - obtaining the data
First, we need to choose an SVM flow, for example 8353, and a task. Finding the IDs of them are not part of this tutorial, this could for example be done via the website.
For this we use the function list_evaluations_setup which can automatically join
evaluations conducted by the server with the hyperparameter settings extracted from the
uploaded runs (called setup).
df = openml.evaluations.list_evaluations_setups(
    function="predictive_accuracy",
    flows=[8353],
    tasks=[6],
    output_format="dataframe",
    # Using this flag incorporates the hyperparameters into the returned dataframe. Otherwise,
    # the dataframe would contain a field ``paramaters`` containing an unparsed dictionary.
    parameters_in_separate_columns=True,
)
print(df.head(n=10))
    run_id  ...  sklearn.pipeline.Pipeline(imputation=hyperimp.utils.preprocessing.ConditionalImputer2,hotencoding=sklearn.preprocessing.data.OneHotEncoder,scaling=sklearn.preprocessing.data.StandardScaler,variencethreshold=sklearn.feature_selection.variance_threshold.VarianceThreshold,clf=sklearn.svm.classes.SVC)(1)_memory
0  9154533  ...                                               null
1  9154536  ...                                               null
2  9154539  ...                                               null
3  9154544  ...                                               null
4  9154546  ...                                               null
5  9154558  ...                                               null
6  9154563  ...                                               null
7  9154569  ...                                               null
8  9154572  ...                                               null
9  9154576  ...                                               null

[10 rows x 46 columns]
We can see all the hyperparameter names in the columns of the dataframe:
for name in df.columns:
    print(name)
run_id
task_id
setup_id
flow_id
flow_name
data_id
data_name
function
upload_time
uploader
uploader_name
value
values
array_data
sklearn.preprocessing.data.OneHotEncoder(17)_categorical_features
sklearn.preprocessing.data.OneHotEncoder(17)_dtype
sklearn.preprocessing.data.OneHotEncoder(17)_handle_unknown
sklearn.preprocessing.data.OneHotEncoder(17)_n_values
sklearn.preprocessing.data.OneHotEncoder(17)_sparse
sklearn.feature_selection.variance_threshold.VarianceThreshold(11)_threshold
sklearn.preprocessing.data.StandardScaler(5)_copy
sklearn.preprocessing.data.StandardScaler(5)_with_mean
sklearn.preprocessing.data.StandardScaler(5)_with_std
sklearn.svm.classes.SVC(16)_C
sklearn.svm.classes.SVC(16)_cache_size
sklearn.svm.classes.SVC(16)_class_weight
sklearn.svm.classes.SVC(16)_coef0
sklearn.svm.classes.SVC(16)_decision_function_shape
sklearn.svm.classes.SVC(16)_degree
sklearn.svm.classes.SVC(16)_gamma
sklearn.svm.classes.SVC(16)_kernel
sklearn.svm.classes.SVC(16)_max_iter
sklearn.svm.classes.SVC(16)_probability
sklearn.svm.classes.SVC(16)_random_state
sklearn.svm.classes.SVC(16)_shrinking
sklearn.svm.classes.SVC(16)_tol
sklearn.svm.classes.SVC(16)_verbose
hyperimp.utils.preprocessing.ConditionalImputer2(1)_axis
hyperimp.utils.preprocessing.ConditionalImputer2(1)_categorical_features
hyperimp.utils.preprocessing.ConditionalImputer2(1)_copy
hyperimp.utils.preprocessing.ConditionalImputer2(1)_fill_empty
hyperimp.utils.preprocessing.ConditionalImputer2(1)_missing_values
hyperimp.utils.preprocessing.ConditionalImputer2(1)_strategy
hyperimp.utils.preprocessing.ConditionalImputer2(1)_strategy_nominal
hyperimp.utils.preprocessing.ConditionalImputer2(1)_verbose
sklearn.pipeline.Pipeline(imputation=hyperimp.utils.preprocessing.ConditionalImputer2,hotencoding=sklearn.preprocessing.data.OneHotEncoder,scaling=sklearn.preprocessing.data.StandardScaler,variencethreshold=sklearn.feature_selection.variance_threshold.VarianceThreshold,clf=sklearn.svm.classes.SVC)(1)_memory
Next, we cast and transform the hyperparameters of interest (C and gamma) so that we
can nicely plot them.
hyperparameters = ["sklearn.svm.classes.SVC(16)_C", "sklearn.svm.classes.SVC(16)_gamma"]
df[hyperparameters] = df[hyperparameters].astype(float).apply(np.log10)
Option 1 - plotting via the pandas helper functions
df.plot.hexbin(
    x="sklearn.svm.classes.SVC(16)_C",
    y="sklearn.svm.classes.SVC(16)_gamma",
    C="value",
    reduce_C_function=np.mean,
    gridsize=25,
    title="SVM performance landscape",
)
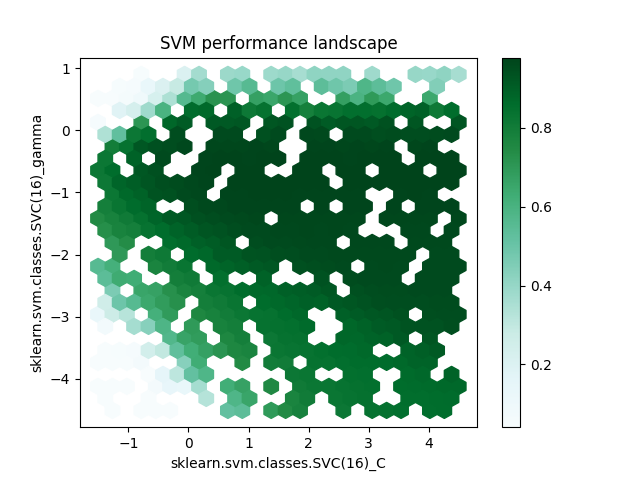
<Axes: title={'center': 'SVM performance landscape'}, xlabel='sklearn.svm.classes.SVC(16)_C', ylabel='sklearn.svm.classes.SVC(16)_gamma'>
Option 2 - plotting via matplotlib
import matplotlib.pyplot as plt

fig, ax = plt.subplots()

C = df["sklearn.svm.classes.SVC(16)_C"]
gamma = df["sklearn.svm.classes.SVC(16)_gamma"]
score = df["value"]

# Plotting all evaluations:
ax.plot(C, gamma, "ko", ms=1)
# Create a contour plot
cntr = ax.tricontourf(C, gamma, score, levels=12, cmap="RdBu_r")
# Adjusting the colorbar
fig.colorbar(cntr, ax=ax, label="accuracy")
# Adjusting the axis limits
ax.set(
    xlim=(min(C), max(C)),
    ylim=(min(gamma), max(gamma)),
    xlabel="C (log10)",
    ylabel="gamma (log10)",
)
ax.set_title("SVM performance landscape")
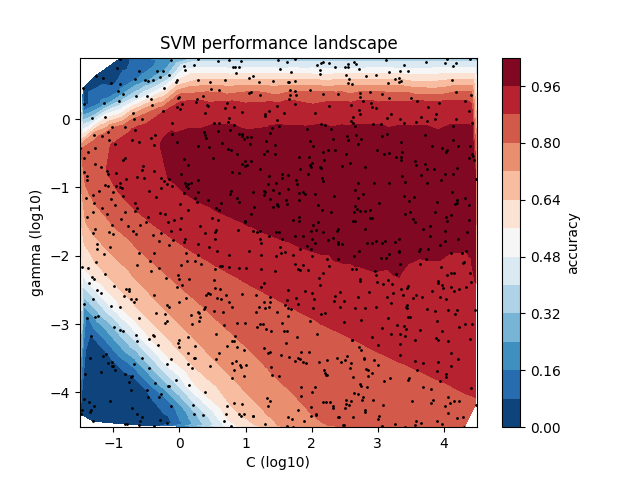
Text(0.5, 1.0, 'SVM performance landscape')
Total running time of the script: (0 minutes 10.793 seconds)