
Note
Go to the end to download the full example code.
Perrone et al. (2018)
A tutorial on how to build a surrogate model based on OpenML data as done for Scalable Hyperparameter Transfer Learning by Perrone et al..
Publication
This example demonstrates how OpenML runs can be used to construct a surrogate model.
In the following section, we shall do the following:
Retrieve tasks and flows as used in the experiments by Perrone et al. (2018).
Build a tabular data by fetching the evaluations uploaded to OpenML.
Impute missing values and handle categorical data before building a Random Forest model that maps hyperparameter values to the area under curve score.
# License: BSD 3-Clause

import openml
import numpy as np
import pandas as pd
from matplotlib import pyplot as plt
from sklearn.pipeline import Pipeline
from sklearn.impute import SimpleImputer
from sklearn.compose import ColumnTransformer
from sklearn.metrics import mean_squared_error
from sklearn.preprocessing import OneHotEncoder
from sklearn.ensemble import RandomForestRegressor

flow_type = "svm"  # this example will use the smaller svm flow evaluations
The subsequent functions are defined to fetch tasks, flows, evaluations and preprocess them into a tabular format that can be used to build models.
def fetch_evaluations(run_full=False, flow_type="svm", metric="area_under_roc_curve"):
    """
    Fetch a list of evaluations based on the flows and tasks used in the experiments.

    Parameters
    ----------
    run_full : boolean
        If True, use the full list of tasks used in the paper
        If False, use 5 tasks with the smallest number of evaluations available
    flow_type : str, {'svm', 'xgboost'}
        To select whether svm or xgboost experiments are to be run
    metric : str
        The evaluation measure that is passed to openml.evaluations.list_evaluations

    Returns
    -------
    eval_df : dataframe
    task_ids : list
    flow_id : int
    """
    # Collecting task IDs as used by the experiments from the paper
    # fmt: off
    if flow_type == "svm" and run_full:
        task_ids = [
            10101, 145878, 146064, 14951, 34537, 3485, 3492, 3493, 3494,
            37, 3889, 3891, 3899, 3902, 3903, 3913, 3918, 3950, 9889,
            9914, 9946, 9952, 9967, 9971, 9976, 9978, 9980, 9983,
        ]
    elif flow_type == "svm" and not run_full:
        task_ids = [9983, 3485, 3902, 3903, 145878]
    elif flow_type == "xgboost" and run_full:
        task_ids = [
            10093, 10101, 125923, 145847, 145857, 145862, 145872, 145878,
            145953, 145972, 145976, 145979, 146064, 14951, 31, 3485,
            3492, 3493, 37, 3896, 3903, 3913, 3917, 3918, 3, 49, 9914,
            9946, 9952, 9967,
        ]
    else:  # flow_type == 'xgboost' and not run_full:
        task_ids = [3903, 37, 3485, 49, 3913]
    # fmt: on

    # Fetching the relevant flow
    flow_id = 5891 if flow_type == "svm" else 6767

    # Fetching evaluations
    eval_df = openml.evaluations.list_evaluations_setups(
        function=metric,
        tasks=task_ids,
        flows=[flow_id],
        uploaders=[2702],
        output_format="dataframe",
        parameters_in_separate_columns=True,
    )
    return eval_df, task_ids, flow_id


def create_table_from_evaluations(
    eval_df, flow_type="svm", run_count=np.iinfo(np.int64).max, task_ids=None
):
    """
    Create a tabular data with its ground truth from a dataframe of evaluations.
    Optionally, can filter out records based on task ids.

    Parameters
    ----------
    eval_df : dataframe
        Containing list of runs as obtained from list_evaluations()
    flow_type : str, {'svm', 'xgboost'}
        To select whether svm or xgboost experiments are to be run
    run_count : int
        Maximum size of the table created, or number of runs included in the table
    task_ids : list, (optional)
        List of integers specifying the tasks to be retained from the evaluations dataframe

    Returns
    -------
    eval_table : dataframe
    values : list
    """
    if task_ids is not None:
        eval_df = eval_df[eval_df["task_id"].isin(task_ids)]
    if flow_type == "svm":
        colnames = ["cost", "degree", "gamma", "kernel"]
    else:
        colnames = [
            "alpha",
            "booster",
            "colsample_bylevel",
            "colsample_bytree",
            "eta",
            "lambda",
            "max_depth",
            "min_child_weight",
            "nrounds",
            "subsample",
        ]
    eval_df = eval_df.sample(frac=1)  # shuffling rows
    eval_df = eval_df.iloc[:run_count, :]
    eval_df.columns = [column.split("_")[-1] for column in eval_df.columns]
    eval_table = eval_df.loc[:, colnames]
    value = eval_df.loc[:, "value"]
    return eval_table, value


def list_categorical_attributes(flow_type="svm"):
    if flow_type == "svm":
        return ["kernel"]
    return ["booster"]
Fetching the data from OpenML
Now, we read all the tasks and evaluations for them and collate into a table. Here, we are reading all the tasks and evaluations for the SVM flow and pre-processing all retrieved evaluations.
eval_df, task_ids, flow_id = fetch_evaluations(run_full=False, flow_type=flow_type)
X, y = create_table_from_evaluations(eval_df, flow_type=flow_type)
print(X.head())
print("Y : ", y[:5])
                     cost degree                gamma  kernel
5193  0.00159429241413488    NaN     181.752067498531     NaN
2464    0.192867395009426    NaN                  NaN  linear
82      0.716338867624746    NaN                  NaN  linear
2301    0.110931877761327    NaN                  NaN  linear
553    0.0136743117655568    NaN  0.00333704847239886     NaN
Y :  5193    0.493294
2464    0.689505
82      0.974565
2301    0.696169
553     0.920973
Name: value, dtype: float64
Creating pre-processing and modelling pipelines
The two primary tasks are to impute the missing values, that is, account for the hyperparameters that are not available with the runs from OpenML. And secondly, to handle categorical variables using One-hot encoding prior to modelling.
# Separating data into categorical and non-categorical (numeric for this example) columns
cat_cols = list_categorical_attributes(flow_type=flow_type)
num_cols = list(set(X.columns) - set(cat_cols))

# Missing value imputers for numeric columns
num_imputer = SimpleImputer(missing_values=np.nan, strategy="constant", fill_value=-1)

# Creating the one-hot encoder for numerical representation of categorical columns
enc = OneHotEncoder(handle_unknown="ignore")

# Combining column transformers
ct = ColumnTransformer([("cat", enc, cat_cols), ("num", num_imputer, num_cols)])

# Creating the full pipeline with the surrogate model
clf = RandomForestRegressor(n_estimators=50)
model = Pipeline(steps=[("preprocess", ct), ("surrogate", clf)])
Building a surrogate model on a task’s evaluation
The same set of functions can be used for a single task to retrieve a singular table which can be used for the surrogate model construction. We shall use the SVM flow here to keep execution time simple and quick.
# Selecting a task for the surrogate
task_id = task_ids[-1]
print("Task ID : ", task_id)
X, y = create_table_from_evaluations(eval_df, task_ids=[task_id], flow_type="svm")

model.fit(X, y)
y_pred = model.predict(X)

print("Training RMSE : {:.5}".format(mean_squared_error(y, y_pred)))
Task ID :  145878
Training RMSE : 9.8235e-06
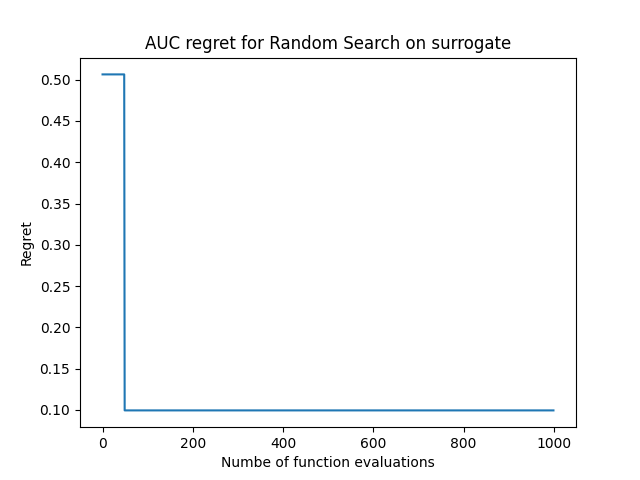
Evaluating the surrogate model
The surrogate model built from a task’s evaluations fetched from OpenML will be put into trivial action here, where we shall randomly sample configurations and observe the trajectory of the area under curve (auc) we can obtain from the surrogate we’ve built.
NOTE: This section is written exclusively for the SVM flow
# Sampling random configurations
def random_sample_configurations(num_samples=100):
    colnames = ["cost", "degree", "gamma", "kernel"]
    ranges = [
        (0.000986, 998.492437),
        (2.0, 5.0),
        (0.000988, 913.373845),
        (["linear", "polynomial", "radial", "sigmoid"]),
    ]
    X = pd.DataFrame(np.nan, index=range(num_samples), columns=colnames)
    for i in range(len(colnames)):
        if len(ranges[i]) == 2:
            col_val = np.random.uniform(low=ranges[i][0], high=ranges[i][1], size=num_samples)
        else:
            col_val = np.random.choice(ranges[i], size=num_samples)
        X.iloc[:, i] = col_val
    return X


configs = random_sample_configurations(num_samples=1000)
print(configs)
           cost    degree       gamma      kernel
0    753.083986  3.583279   50.737294  polynomial
1    355.526301  3.878007   41.679450      linear
2    932.432157  3.145557  389.464725     sigmoid
3    953.159145  4.038180  827.401051     sigmoid
4    574.413551  4.234187  163.051256      radial
..          ...       ...         ...         ...
995  254.727697  4.246266  646.101839  polynomial
996  591.986261  2.800502  601.801761  polynomial
997  275.642334  3.442371  777.160153      radial
998   87.852844  3.368254  383.192396      radial
999  108.931212  4.528182  713.249618      linear

[1000 rows x 4 columns]
preds = model.predict(configs)

# tracking the maximum AUC obtained over the functions evaluations
preds = np.maximum.accumulate(preds)
# computing regret (1 - predicted_auc)
regret = 1 - preds

# plotting the regret curve
plt.plot(regret)
plt.title("AUC regret for Random Search on surrogate")
plt.xlabel("Numbe of function evaluations")
plt.ylabel("Regret")
Text(33.972222222222214, 0.5, 'Regret')
Total running time of the script: (0 minutes 36.175 seconds)